
Case Study: First Photograph of a Black Hole
NumFOCUS tools help create the first ever image of a black hole
In spring 2019, scientists successfully created the first ever image of a black hole — a breakthrough made possible by NumFOCUS open source software projects.
More than 4.5 billion people have now seen this image:

Although scientists have been researching and theorizing black holes for decades, this is the first ever visual image of a black hole. This picture is the result of a massive collaborative effort through a project called the Event Horizon Telescope, or EHT.
The black hole pictured above lies at the center of a galaxy called M-87, which is 55 million light-years away. To understand the effort required to take a picture of it, imagine trying to photograph a grain of sand in Los Angeles—while standing in New York. “Taking the first image of a black hole was a huge endeavor,” said Katie Bouman, one of the lead scientists and developers on the project. “Because it is so small, we needed to build an earth-sized telescope.”
Rather than actually build a massive telescope the size of the earth, over 200 scientists spent decades linking a series of telescopes around the globe into a network, using the precise timing of atomic clocks, to create a massive, virtual telescope capable of taking the picture. “It took many people years of hard work in order to build a computational telescope that made it possible to see the unseeable,” said Dr. Bouman.
The global network of telescopes recorded a huge amount of data, which then took years of processing to finally compose the image.
The global network of telescopes recorded a huge amount of data, which then took years of processing to finally compose the image. Because it took a whole new “photographic” approach to build and connect the equipment to even take this picture, it similarly meant taking a new approach to processing the data in order to develop it into a single visual image. If building the global network of telescopes was like using a very fancy new camera, then the computational algorithms that are used to process and interpret the collected data to form the image are akin to a very fancy darkroom and photo development process. New equipment requires new development techniques, and in this case, the “development” was in the form of code.
To See a Black Hole, Remove “Noise” from the Data
Chi-Kwan Chan architected and maintained the cloud computing infrastructure for the EHT and developed software for the data analysis pipeline and reconstruction algorithm for the now famous image. Dr. Chan explained that the data generated by the EHT telescope network was truly unique: “Experiments of this scale had not been tried before.”
In order to effectively and accurately interpret the data from the telescopes, Dr. Chan said the upmost care had to be taken to eliminate coding errors and bugs.
“Experiments of this scale had not been tried before.”
For instance, because the EHT isn’t a single telescope or a network of similar types of telescopes, there is a lot of “noise,” or different types of potential errors, which can come from the data generated by the telescope network.
“One of the biggest sources of noise is the atmospheric effect,” said Dr. Chan. “We are looking through the atmosphere to detect the radio wave. But there are things like water vapor, clouds, and turbulence in the atmosphere that can change the signal. So we need to find ways to remove these effects in the atmosphere.”
The scientists used a variety of algorithms to remove different types of noise from the data pipelines. Since this was the first experiment of its kind at this scale, multiple data analysis pipelines were used, each pipeline slightly different, so that scientists could check each pipeline against each other and ensure the scientific integrity of the final image.
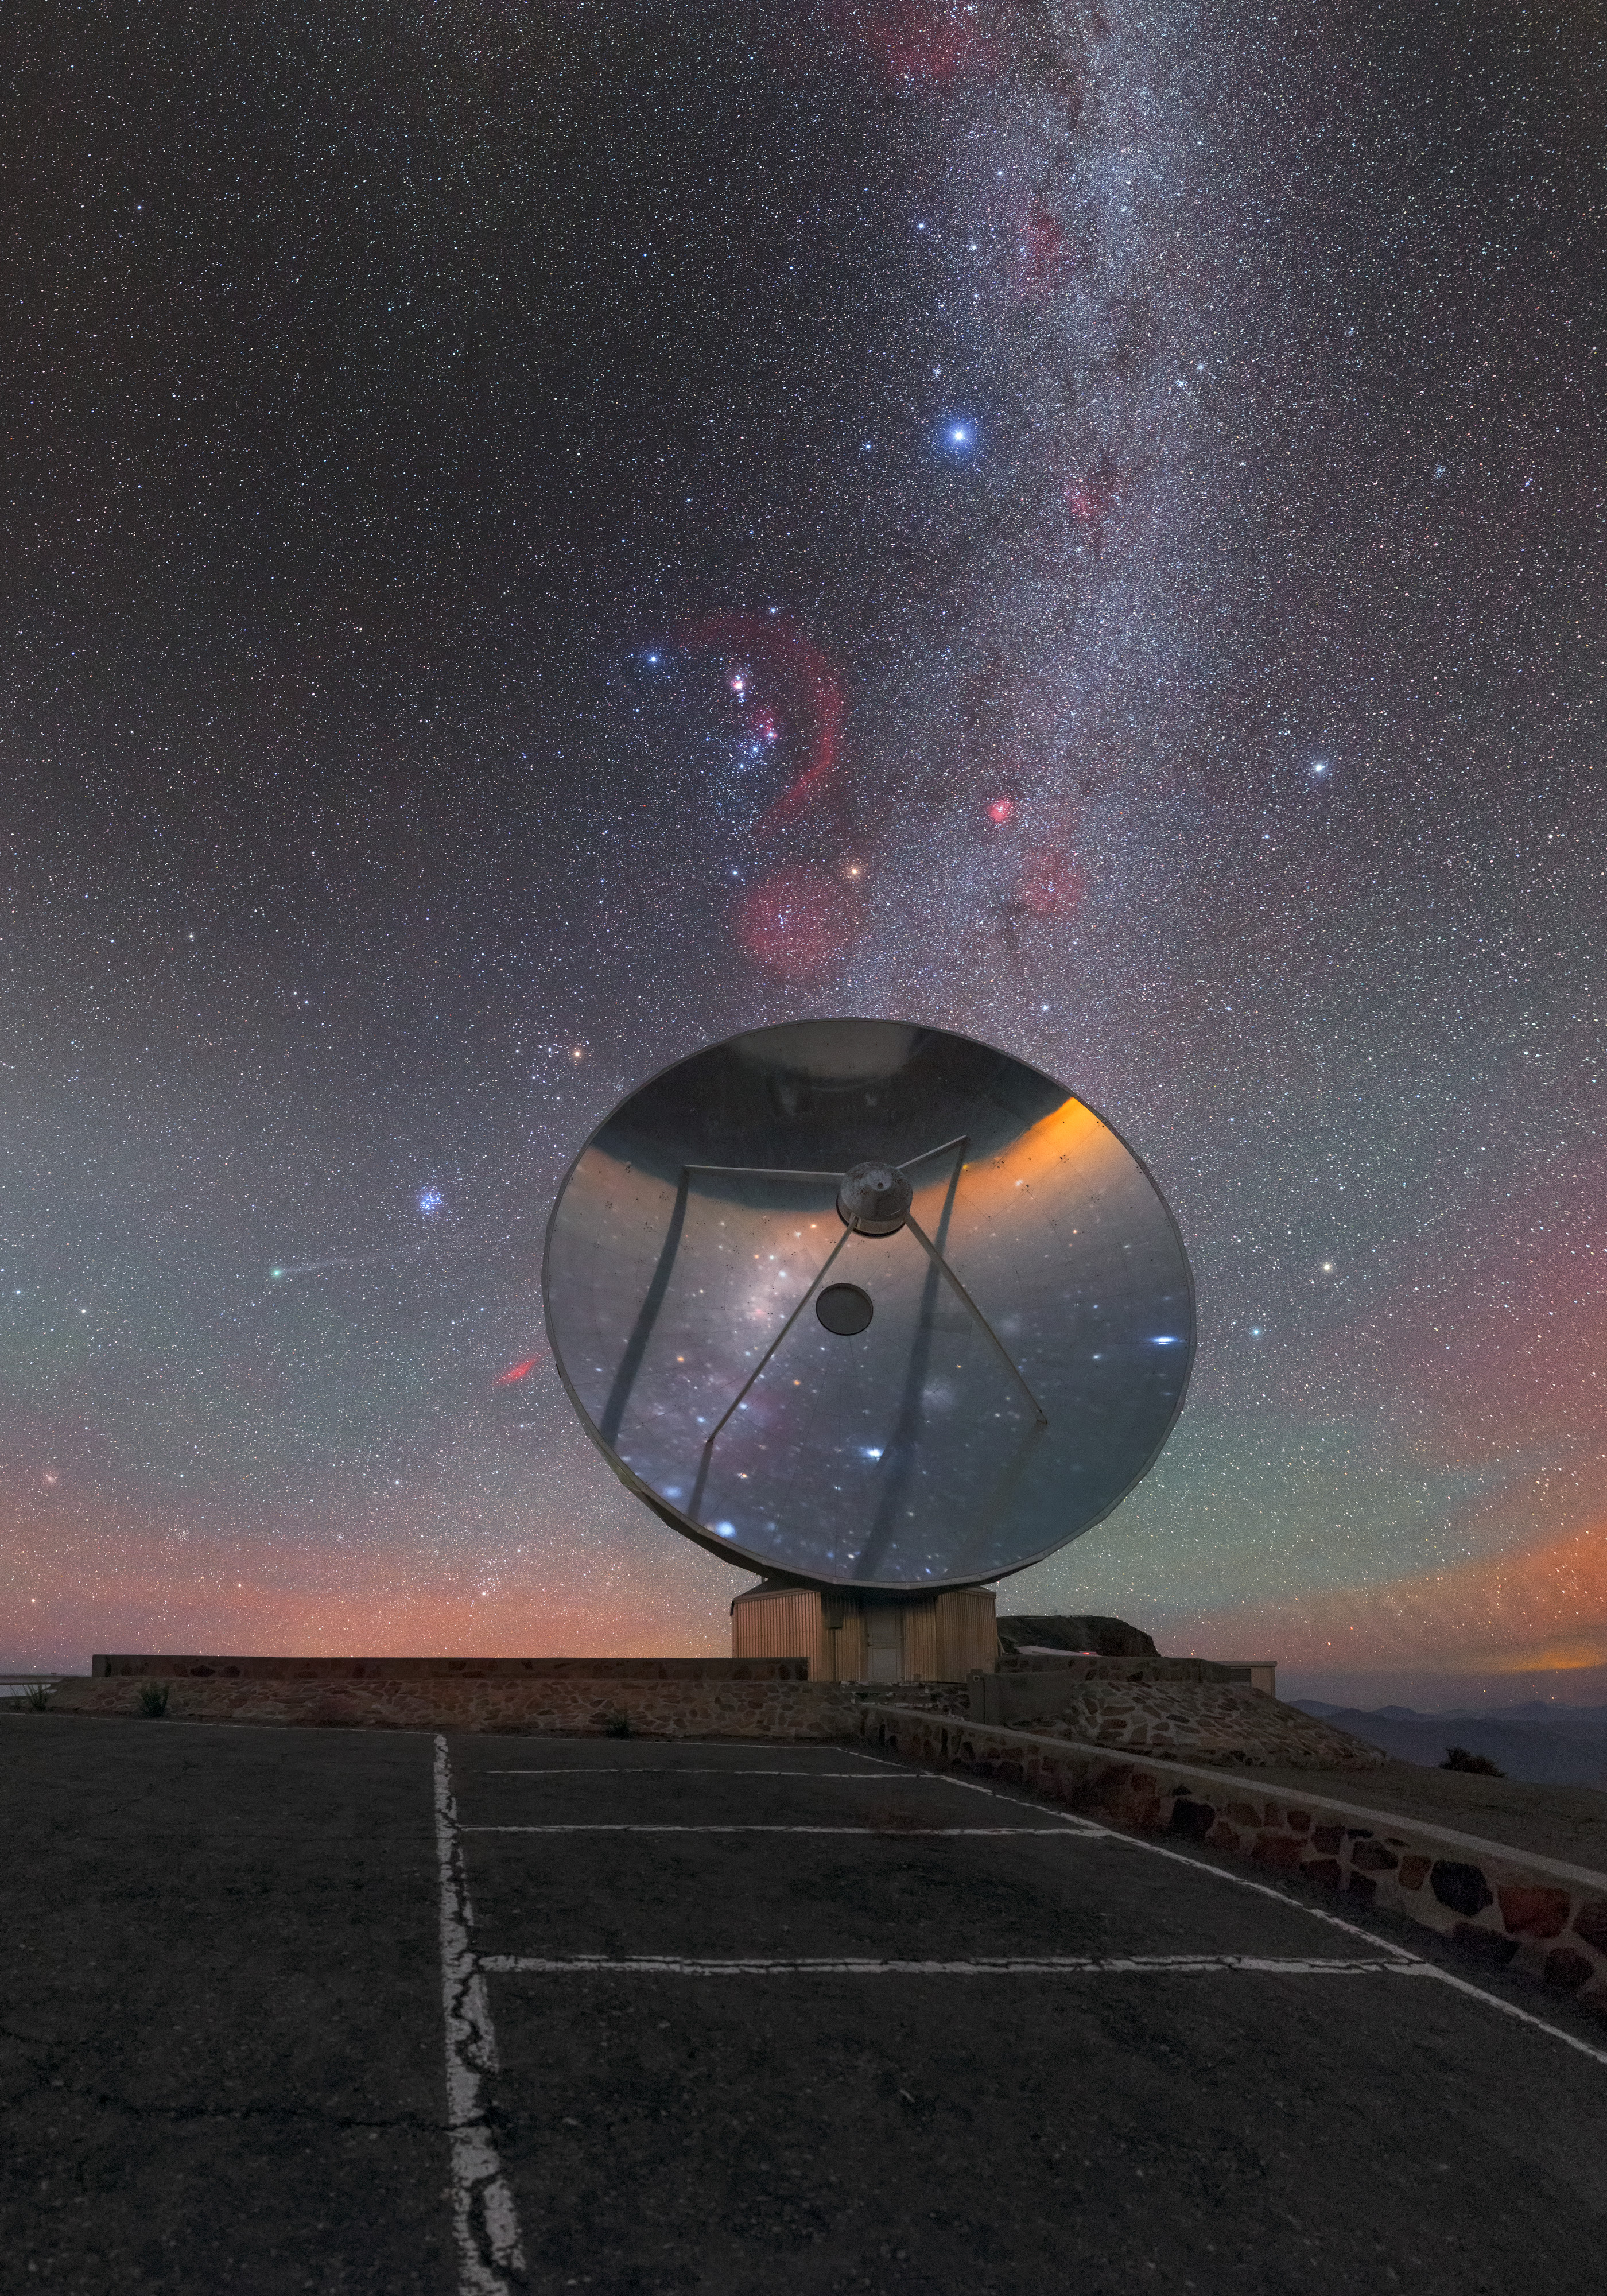
Credit: ESO/Petr Horálek
The Speed and Power of Python
Although the HOPS pipeline Dr. Chan helped develop is mainly written in the C programming language, EHT scientists also developed a lot of Python code around it to drive the analysis. Dr. Chan explained that there is a huge advantage in using Python for analysis because it enables scientists to do their work more quickly. Because this was the first time scientists had seen this type of data, they needed to be able to try different things on the fly—and Python is a great language for this explorative approach. “A lot of our work is actually working with and thinking about the data, and Python lets us speed up the process,” he said.
Dr. Chan pointed to NumFOCUS-supported open source tools — Numpy, SciPy, pandas, Astropy, Jupyter, and Matplotlib — as crucial to this iterative scientific thinking process. “It is thought that Python alone would be too slow to process our volumes of data. However, with the open source projects in NumFOCUS, we were able to iterate our algorithms so fast that they enabled us to finish our work in two years, which would be difficult to achieve if we just used C.”
“with the open source projects in NumFOCUS, we were able to iterate our algorithms so fast that they enabled us to finish our work in two years”
pandas
NumPy
SciPy
Matplotlib
Astropy
Jupyter
Dr. Lindy Blackburn, the leader of the EHT Calibration and Error Analysis Working Group, agreed: “The wealth of open source scientific software allows us to focus on our own analysis algorithms and experiment-specific problems rather than the implementation of underlying dependencies. This completely changes the timeline for development, increases our ability to try new things, and increases the overall quality and consistency of our underlying toolset.”
“Many of the data analyses we do in science is not just about how fast a computer can do things,” Dr. Chan said. “Because at the end scientists are the ones who design and implement the algorithm. Putting the human factor in this development/analysis cycle, Python and other open source software have the advantage to really speed things up.”
For example, in order to investigate and understand the data in the data processing and clean-up stage, Matplotlib was used to visualize outliers. Dr. Chan emphasized that being able to visualize the data, look at the outlier, and fix problems are very important to this type of scientific research.
Although technically algorithms can detect outliers without a human looking at the data, Dr. Chan explained that it’s hard to decide which algorithm to use unless you’ve actually looked at the data first. “Although everyone is talking about machine learning and AI these days, in science, we still need the human, be it the astronomer or other experts, to look at the data first to decide if some AI or statistical algorithm is good enough to process the data.”
Reproducibility: Eliminating Human Errors
The complexity of the black hole image-creation process and the massive amount of data and processing involved increased the risk of errors and potentially misleading image results. For this reason, there were many redundancies built into the whole process, including three data analysis pipelines and four independent teams to reconstruct the image. For example, after they processed the data, no one on the imaging teams were permitted yet to see the images. First, the processed data had to go through a data review, where experts looked at the data, asked questions about its quality, and gave feedback on how to improve it.
Further, the scientists working on these algorithms naturally had some expectations of what a black hole would probably look like, which in itself was a danger to the scientific process. Dr. Chan explains: “One dangerous thing here is if we just look at the results with a single algorithm, then once we find something that reaches our expectations, we would come to a stop. This is not about being disingenuous or lazy: this is just the human nature of trusting in something unless proven otherwise.”
To tackle this challenge, the EHT scientists split into four image reconstruction teams, with each team independently working to create a version of the black hole image using its own techniques and parameters for constructing the image. “At the end, we used an algorithm to compare these four results,” said Chan, “and only when the results agreed, we unveiled the image to all teams and came together to discuss how to make improvements.”
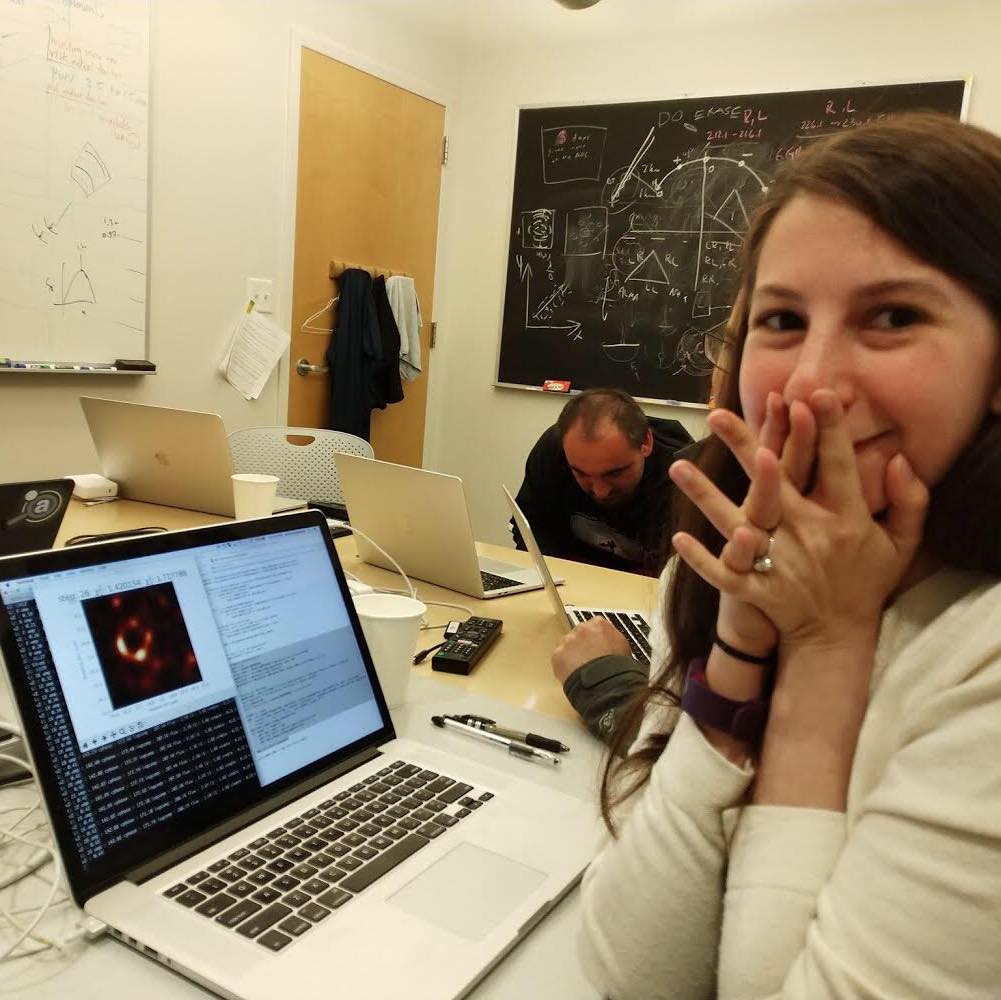
This is actually what was happening at the moment when the now-famous picture of Dr. Bouman was taken; each of the researchers on the four separate imaging teams were running the image processing individually on their computers at the same time. So, although the photo of Dr. Bouman is the most famous representation of the moment of discovery, each member of the EHT team was in fact experiencing the same disbelief, awe, and excitement at that moment watching the image resolved itself on their screens.
Large Collaborations and the Future of Research
The international, collaborative nature of the EHT research now constitutes the cutting edge of approaches to scientific inquiry. According to Dr. Chan, if a problem can be tackled in a single lab, then it may have already been done; this means that real breakthroughs increasingly come from researchers joining forces.
Today, many experiments in observational science are done in these types of large collaborations. This is especially true for particle physics, which requires very large instruments like the virtual telescope. (For example, many of the same NumFOCUS projects were used in the Nobel prize-winning discovery of two black holes colliding.)
It took over 200 global collaborators to create the cutting-edge instrumentation, data processing, theoretical simulations, and analysis necessary to compose the first image of a black hole. Most members of the EHT collaboration are scientists, but some are staff at the telescopes, electrical engineers, and people with a variety of different backgrounds. The EHT team is from almost 60 different institutes in total, across 80 countries.
And that isn’t even counting the 21,485 contributors who worked on the open source codes that the EHT image relies on! These are the individuals, mostly volunteers, who contributed to the creation and maintenance of open source tools used to produce the black hole image.
The EHT researchers were explicit and effusive in their gratitude to the community of open source contributors who build and maintain the scientific tools powering their discovery:
“We’re deeply grateful to all the open source contributors who made our work possible.” –Dr. Katie Bouman
We “greatly improve[d] our own work by adopting well-tested community packages that contain the collected wisdom of many other projects.” –Dr. Lindy Blackburn
“The open source community is very important for scientists; imagine if we had to do everything from scratch every single time.” –Dr. Chi-Kwan Chan