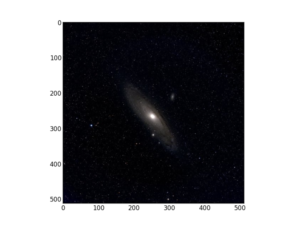
Ole Moeller-Nilsson, CTO at Pivigo, was kind enough to share his insights on how a beginner can easily get started exploring astronomy using Python. This blog post grew out of a presentation he gave at PyData London meetup on March 7th.
Python is a great language for science, and specifically for astronomy. The various packages such as NumPy, SciPy, Scikit-Image and AstroPy (to name but a few) are all a great testament to the suitability of Python for astronomy, and there are plenty of use cases. [NumPy and AstroPy are NumFOCUS fiscally sponsored projects; SciPy and Scikit-Image are affiliated projects.] Since leaving the field of astronomical research behind more than 10 years ago to start a second career as software developer, I have always been interested in the evolution of these packages. Many of my former colleagues in astronomy used most if not all of these packages for their research work. I have since worked on implementing professional astronomy software packages for instruments for the Very Large Telescope (VLT) in Chile, for example.
It struck me recently that the Python packages have evolved to such an extent that it is now fairly easy for anyone to build data reduction scripts that can provide high quality data products. Astronomical data is ubiquitous, and what is more, it is almost all publicly available—you just need to look for it.
For example, ESO, which runs the VLT, offers the data for download on their site. Head over to www.eso.org/UserPortal and create a user name for their portal. If you look for data from the instrument SPHERE you can download a full dataset for any of the nearby stars that have exoplanet or proto-stellar discs. It is a fantastic and exciting project for any Pythonista to reduce that data and make the planets or discs that are deeply hidden in the noise visible.
I encourage you to download the ESO or any other astronomy imaging dataset and go on that adventure. Here are a few tips:
- Start off with a good dataset. Have a look at papers about nearby stars with discs or exoplanets and then search, for example: https://archive.eso.org/wdb/wdb/eso/sphere/query. Notice that some data on this site is marked as red and some as green. The red data is not publicly available yet — it will say under “release date” when it will be available.
- Read something about the instrument you are using the data from. Try and get a basic understanding of how the data is obtained and what the standard data reduction should look like. All telescopes and instruments have publicly available documents about this.
- You will need to consider the standard problems with astronomical data and correct for them:
- Data comes in FITS files. You will need pyfits or astropy (which contains pyfits) to read them into NumPy arrays. In some cases the data comes in a cube and you should to use numpy.median along the z-axis to turn them into 2-D arrays. For some SPHERE data you get two copies of the same piece of sky on the same image (each has a different filter) which you will need to extract using indexing and slicing.
- The master dark and bad pixel map. All instruments will have specific images taken as “dark frames” that contain images with the shutter closed (no light at all). Use these to extract a mask of bad pixels using NumPy masked arrays for this. This mask of bad pixels will be very important — you need to keep track of it as you process the data to get a clean combined image in the end. In some cases it also helps to subtract this master dark from all scientific raw images.
- Instruments will typically also have a master flat frame. This is an image or series of images taken with a flat uniform light source. You will need to divide all scientific raw images by this (again, using numpy masked array makes this an easy division operation).
- For planet imaging, the fundamental technique to make planets visible against a bright star rely on using a coronagraph and a technique known as angular differential imaging. To that end, you need to identify the optical centre on the images. This is one of the most tricky steps and requires finding some artificial helper images embedded in the images using skimage.feature.blob_dog.
- Be patient. It can take a while to understand the data format and how to handle it. Making some plots and histograms of the pixel data can help you to understand it. It is well worth it to be persistent! You will learn a lot about imaging data and processing.
Using the tools offered by NumPy, SciPy, AstroPy, scikit-image and more in combination, with some patience and persistence, it is possible to analyse the vast amount of available astronomical data to produce some stunning results. And who knows, maybe you will be the first one to find a planet that was previously overlooked! Good luck!

